Thread Rating:
  • 0 Vote(s) - 0 Average
  • 1
  • 2
  • 3
  • 4
  • 5
And now for something completely different - a strong jobs report!
#1
Better than expected. Nov/Dec report was also revised upward.

http://www.bls.gov/news.release/pdf/empsit.pdf

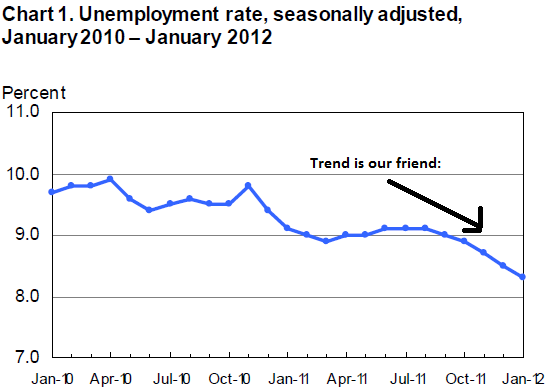
"Total nonfarm payroll employment rose by 243,000 in January, and the unemployment rate
decreased to 8.3 percent, the U.S. Bureau of Labor Statistics reported today. Job growth was widespread
in the private sector, with large employment gains in professional and business services, leisure and
hospitality, and manufacturing. Government employment changed little over the month."
Reply
#2
[snark]
President Obama is SO incompetent, he can't even kill jobs and keep the economy from recovering right! [/snark]
Reply
#3
the market is optimistic about Mitt!
Reply
#4
This is good news. I haven't been paying attention to much, and obviously this gets extremely complicated, but I wonder how much of economic uncertainly in the US in the past year or two has been driven by the European debt crisis. Maybe the US is pulling out of the bottom finally even as that has dragged on and still isn't resolved.
Reply
#5
It's only one month so lets not get too excited. The overall trend is in the right direction and that is good.

I'm reminded of a saying that a friend of mine is fond of using:- One swallow does not a fellatrix make.
Reply
#6
"The trend is our friend."

Reply
#7
Grace62 wrote:
"The trend is our friend."


Man, whenever I see charts like this, I cringe.

I learned in high school math that you HAVE to begin the vertical axis at 0 for things like this.

What is magical about 7? It magnifies the difference beyond the realistic change.

(This is not meant to be a political swipe at the drop in unemployment, just an observation about graphs and how misleading they can be)
Reply
#8
What is magical about 7? It magnifies the difference beyond the realistic change.

I don't think so.
The graph shows a trend over a certain period of time, you won't get a different looking trend if you add a bunch of empty space at the bottom.

Look at this graph from the BLS. It starts at 4% for unemployment. Look at the 2 year period we are seeing above. You see the same shape curve. Three more numbers were added to the vertical axis but you see the same shape.


http://data.bls.gov/timeseries/LNS14000000

Reply
#9
its an old saw about information design. yes, it emphasizes short term changes rather than absolute values.
Reply
#10
A trend is a trend, but one must be careful not to give the wrong impression when making graphs. In this case, magnification is a pretty apt description, but I wouldn't consider it a terrible distortion. Kj.


[quote=Grace62]
What is magical about 7? It magnifies the difference beyond the realistic change.

I don't think so.
The graph shows a trend over a certain period of time, you won't get a different looking trend if you add a bunch of empty space at the bottom.

Look at this graph from the BLS. It starts at 4% for unemployment. Look at the 2 year period we are seeing above. You see the same shape curve. Three more numbers were added to the vertical axis but you see the same shape.


http://data.bls.gov/timeseries/LNS14000000

Reply


Forum Jump:


Users browsing this thread: 1 Guest(s)